Pathology|10 Nov 2026
Reading your spore dashboard in the weeks after budburst

BioScout
5 Min Read
SporeScout dashboard on a tablet
Budburst is when the spore dashboard starts to earn its place. Green tissue is out, the first downy mildew and powdery mildew infections of the season become possible, and every spray decision from now to fruit set has a cost. This guide covers what the dashboard shows, how to read it in the first weeks after budburst, and how to make it more useful as the season goes on.
What updates, and when
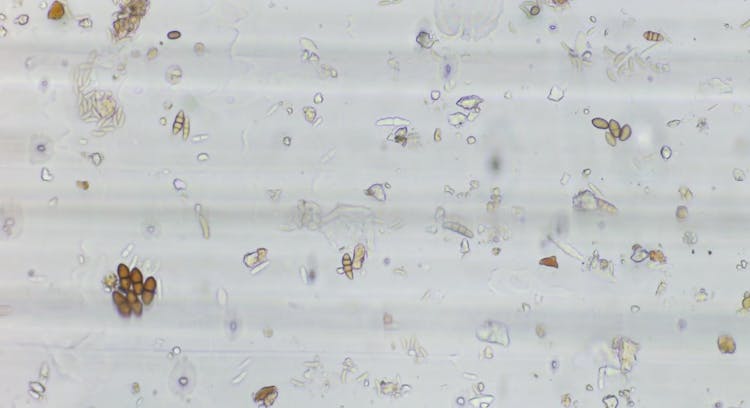
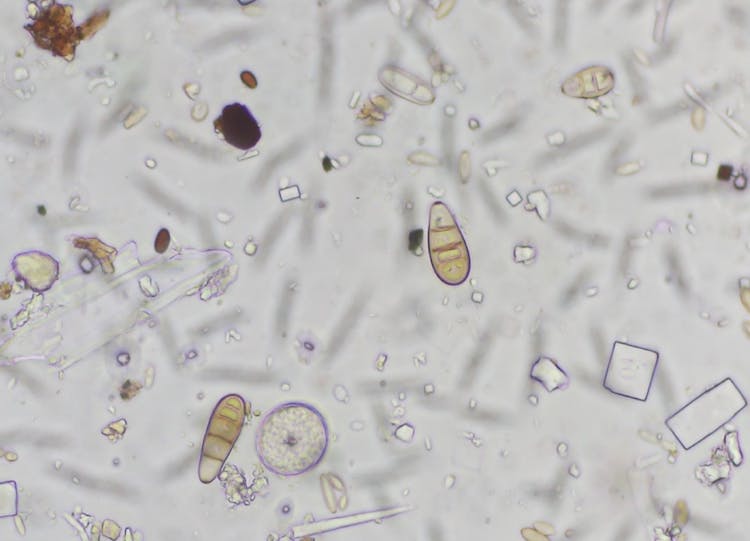
Your SporeScout takes one sample a day. It images what it catches at 400x, and our automated AI algorithm identifies and counts the spores of each target pathogen. The reading is usually on your dashboard within 4 hours of the daily scan finishing. If the unit loses its connection, it keeps the data and sends it when the connection returns, so a gap on the graph usually fills in later.
The infection risk for each disease with a risk model is recalculated every hour as new weather data comes in.
Spore graphs: read the band, not the height
Each disease has its own spore graph for each device, showing spore concentration day by day. Behind the line are three threshold bands:
Green
Low or background spore levels.
Yellow
Elevated: watch more closely.
Red
High spore levels: infection risk is raised if the weather also suits the disease, especially at a susceptible growth stage.
Read the band before the height of the line. The graph scales itself to the data, so in a quiet week a small rise can look as dramatic as a large one. A spike that stays in the green band is still background. How much a red reading matters also depends on what growth stage the crop is at.
We set the bands for each disease from published research, then refine them with data from BioScout sites and our pathologists' judgement. They are a guide, not a hard rule. If your block history, variety, or risk tolerance suggests different levels, our science team can adjust them with you: use Contact Support in the dashboard.
Infection risk: spores and weather together
For diseases with a risk model, an infection risk graph sits under the spore graph. It combines recent spore detections with the temperature and humidity the pathogen needs. Where a disease needs leaf wetness to infect, the model uses relative humidity as a proxy for it: long periods of high humidity at a temperature that suits the disease raise the risk.
The risk is shown in four levels: Low, Low-Moderate, Moderate-High, and Severe. A vertical line marks today. To the left is what happened, using your sensor's weather; to the right is a forecast up to seven days ahead.
The same weather window scores lower when no spores have been detected. That is the point of measuring spores: weather alone tells you infection is possible, and the spore count tells you whether the pathogen/ inoculum is in the air at your site to take the chance.
As a rule of thumb:
- Low: action is unlikely to be needed.
- Low-Moderate: infection is possible. Spores or weather favours the disease, but not both. Your response depends on your risk tolerance, growth stage and what you see in the rows.
- Moderate-High: infection is likely. Spores and weather both lean towards the disease. Consider getting protection on, especially at a susceptible growth stage.
- Severe: take it seriously, especially at a vulnerable growth stage.
The first weeks after budburst
Early in the season, expect most graphs to sit in the green band. That is useful information: it is the baseline you will compare against later.
Three habits make the next months easier:
- Check the forecast side of the risk graph before you book a spray. If spores are in the yellow or red band and the forecast shows Moderate-High or Severe in the next few days, that is the window to get protection on. If spores are in the green band, the same forecast carries less weight.
- Log every spray. Under Notes > Spray Diary Log, choose Register Spray Log and record the product, active ingredient, rate, block and variety. The weather at spraying fills in from your reference device. Each spray appears as a blue marker on the graphs, so you can see later whether it landed before or after pressure built.
- Log what you see. Under Notes > Grower Observations, record oil spots, flag shoots, lesions, canopy work or anything else that matters, and attach a photo. Observations sit on the graphs beside the spore data, which makes it far easier to judge at the end of the season whether the counts matched what happened in the rows.
If you want to work with the numbers yourself, export the graph's data as a CSV for the device, disease and dates on screen.
What the dashboard does not do
The dashboard tells you what is in the air and when the weather favours infection. It does not see your canopy. Keep scouting, weigh the data against growth stage and spray history, and talk to your agronomist about thresholds for your blocks. Used that way, the daily count is one more piece of evidence, delivered every morning, that a calendar program does not have.