Stop guessing. Access near real‑time disease data from the world’s first national surveillance network, supported by GRDC.
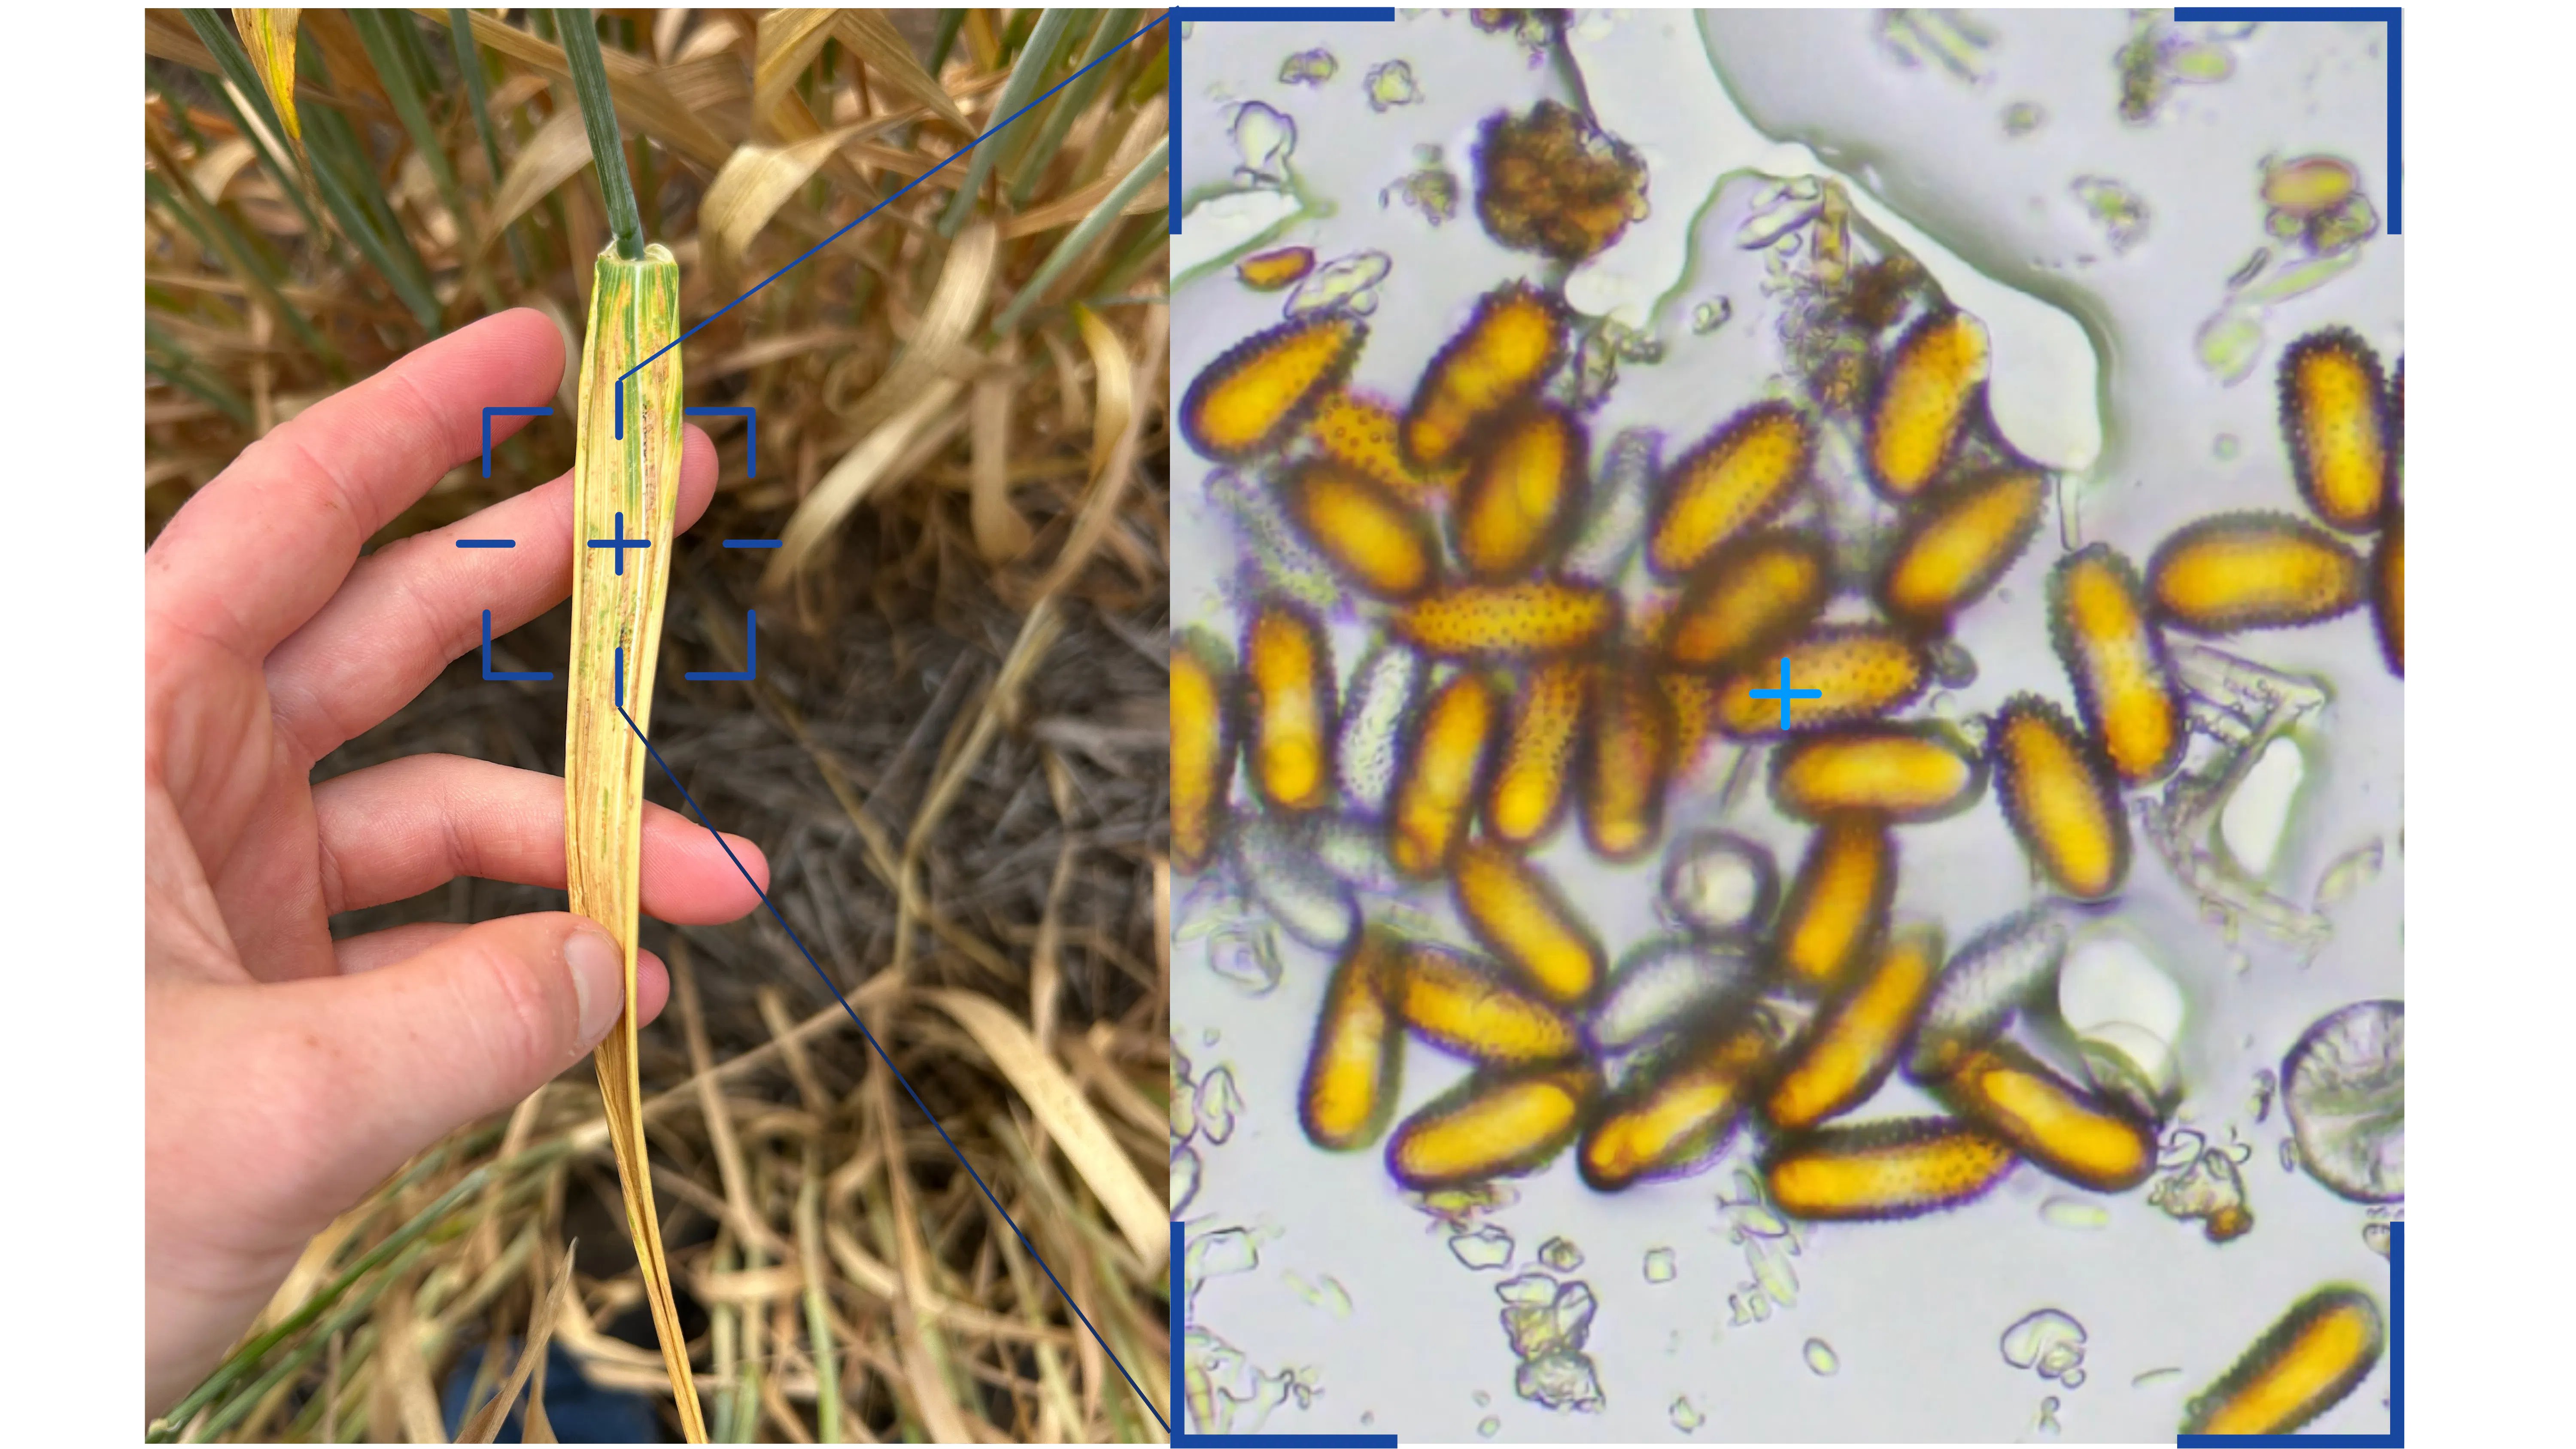
Our 60 sensors across the Australian Wheatbelt use automated microscopy to identify live airborne spores and deliver the data to your phone.
Now you can make informed decisions to protect your crops and optimise yields like never before.
No simulations. No cost. Just near real-time biological data.
Join the Network Now!
How It Works
BioScout has partnered with the Grains Research and Development Corporation (GRDC) to deploy a multimillion dollar network of sensors across South Australia, Western Australia, Victoria, and New South Wales.

Spot infection risk before symptoms appear.
Monitor near real-time pressure for general rust, blackleg, cereal powdery mildew, botrytis, and alternaria. See these spore loads using a simple "traffic light" system (Green to Red), allowing you to instantly gauge the disease intensity in your district.
See the disease heading your way.
Find the sensors closest to or upwind from your farm and see your immediate disease pressure. Look for trends in units further away and see if something is coming in your direction. Use them as an early warning system to prepare days before the pressure reaches your boundary. See which diseases are threatening your crops, and which aren’t, so you can make smarter product choices with better timing.

Learn from the season behind you.
Review historical trends to identify the "first appearance" of disease in your district. Our retrospective analysis helps you understand how weather events correlated with spore spikes, allowing you to refine your management strategy for the season ahead.
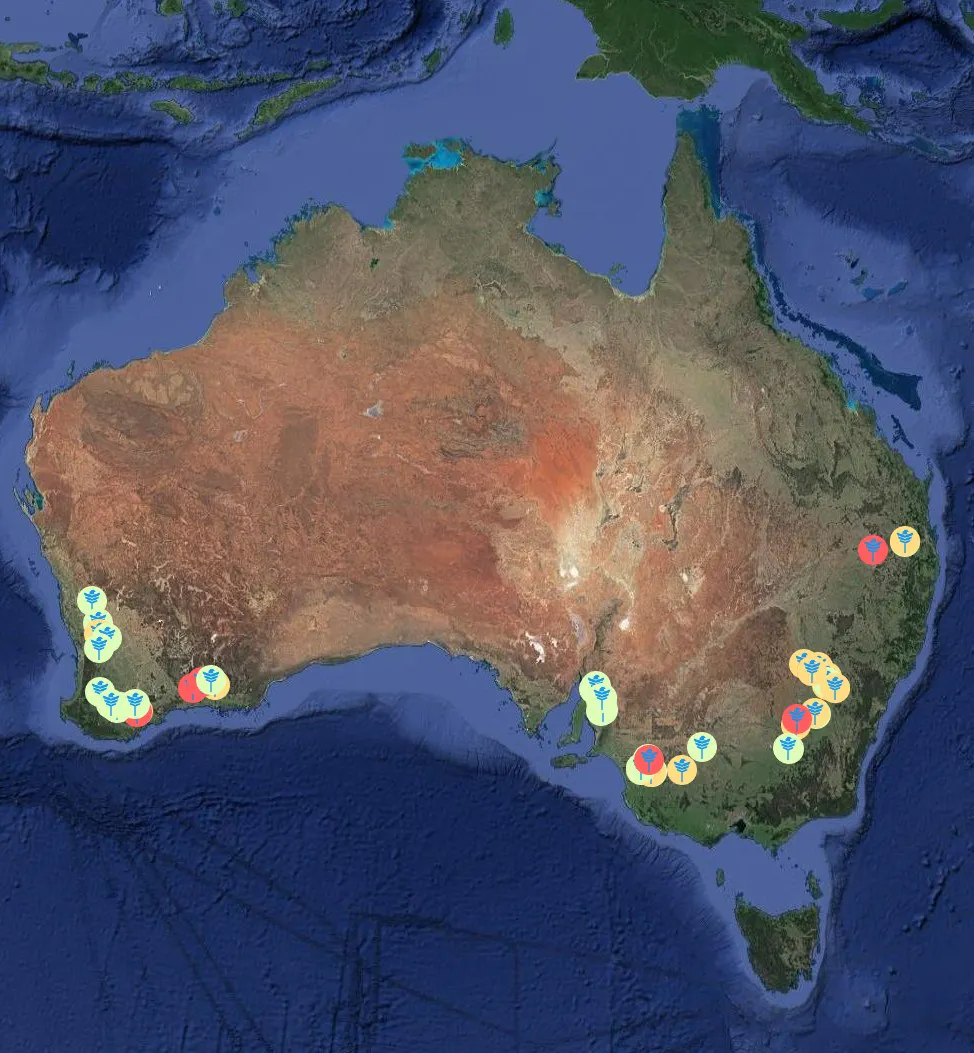
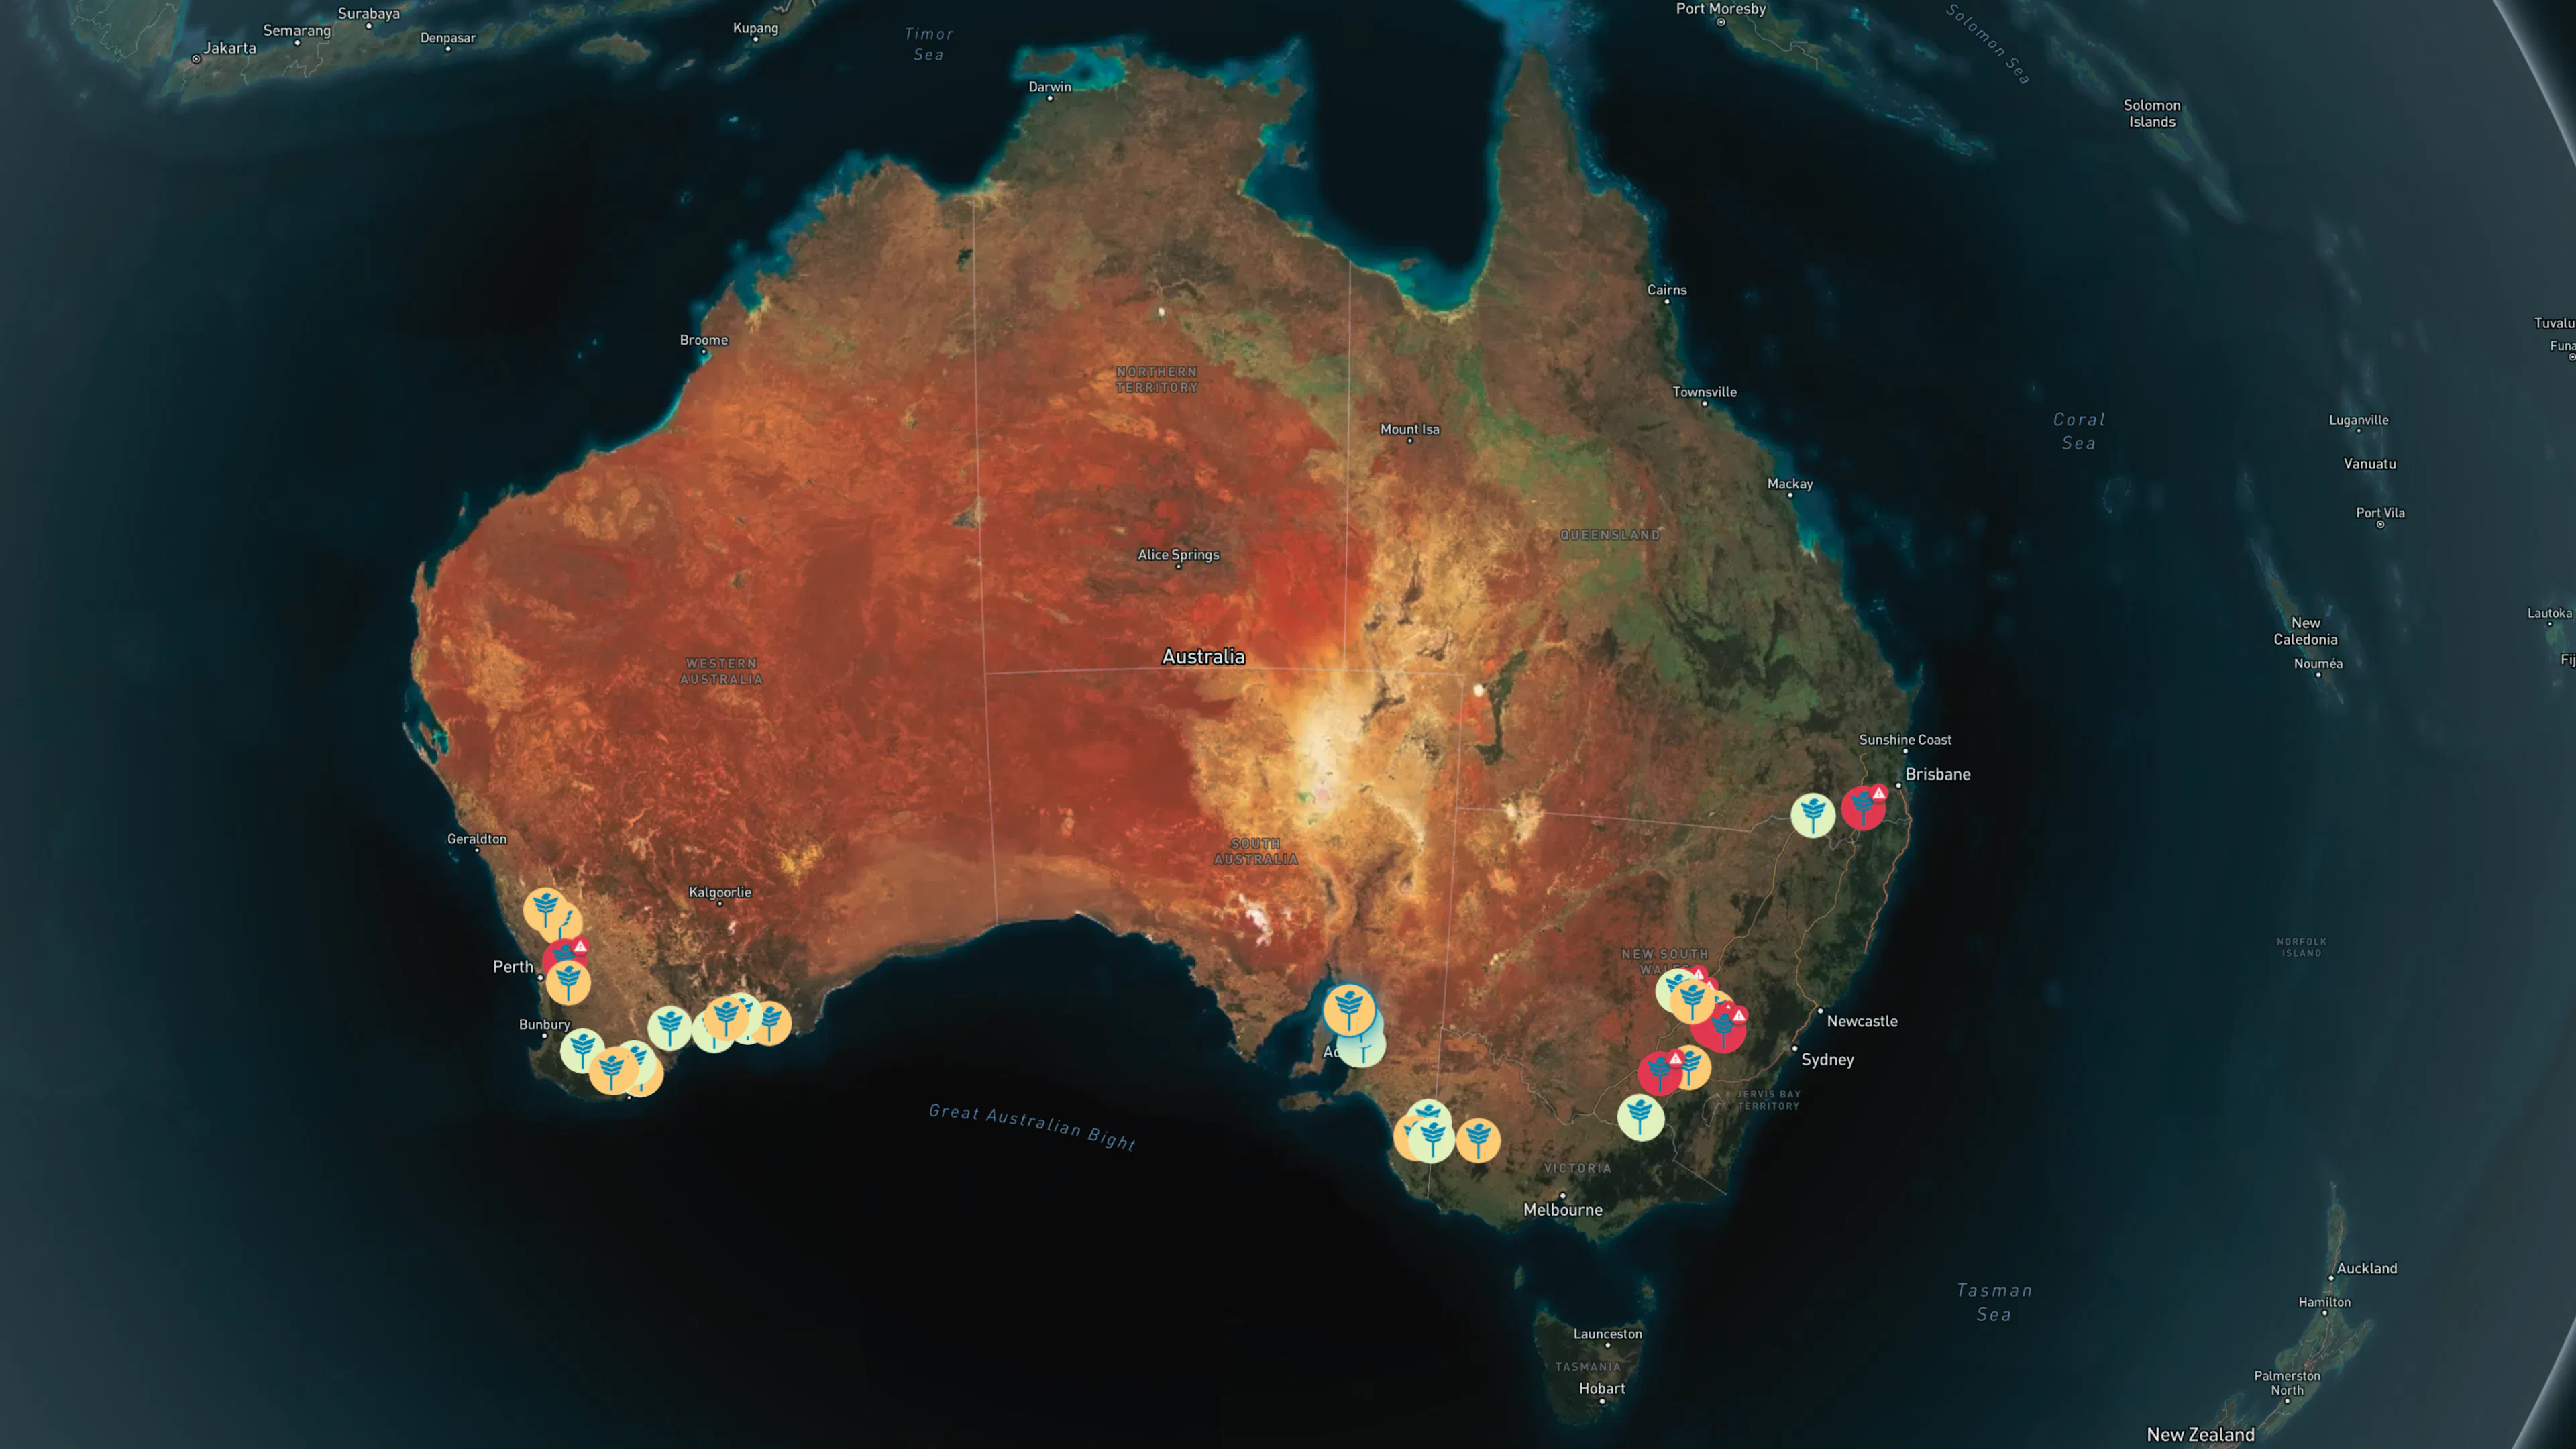
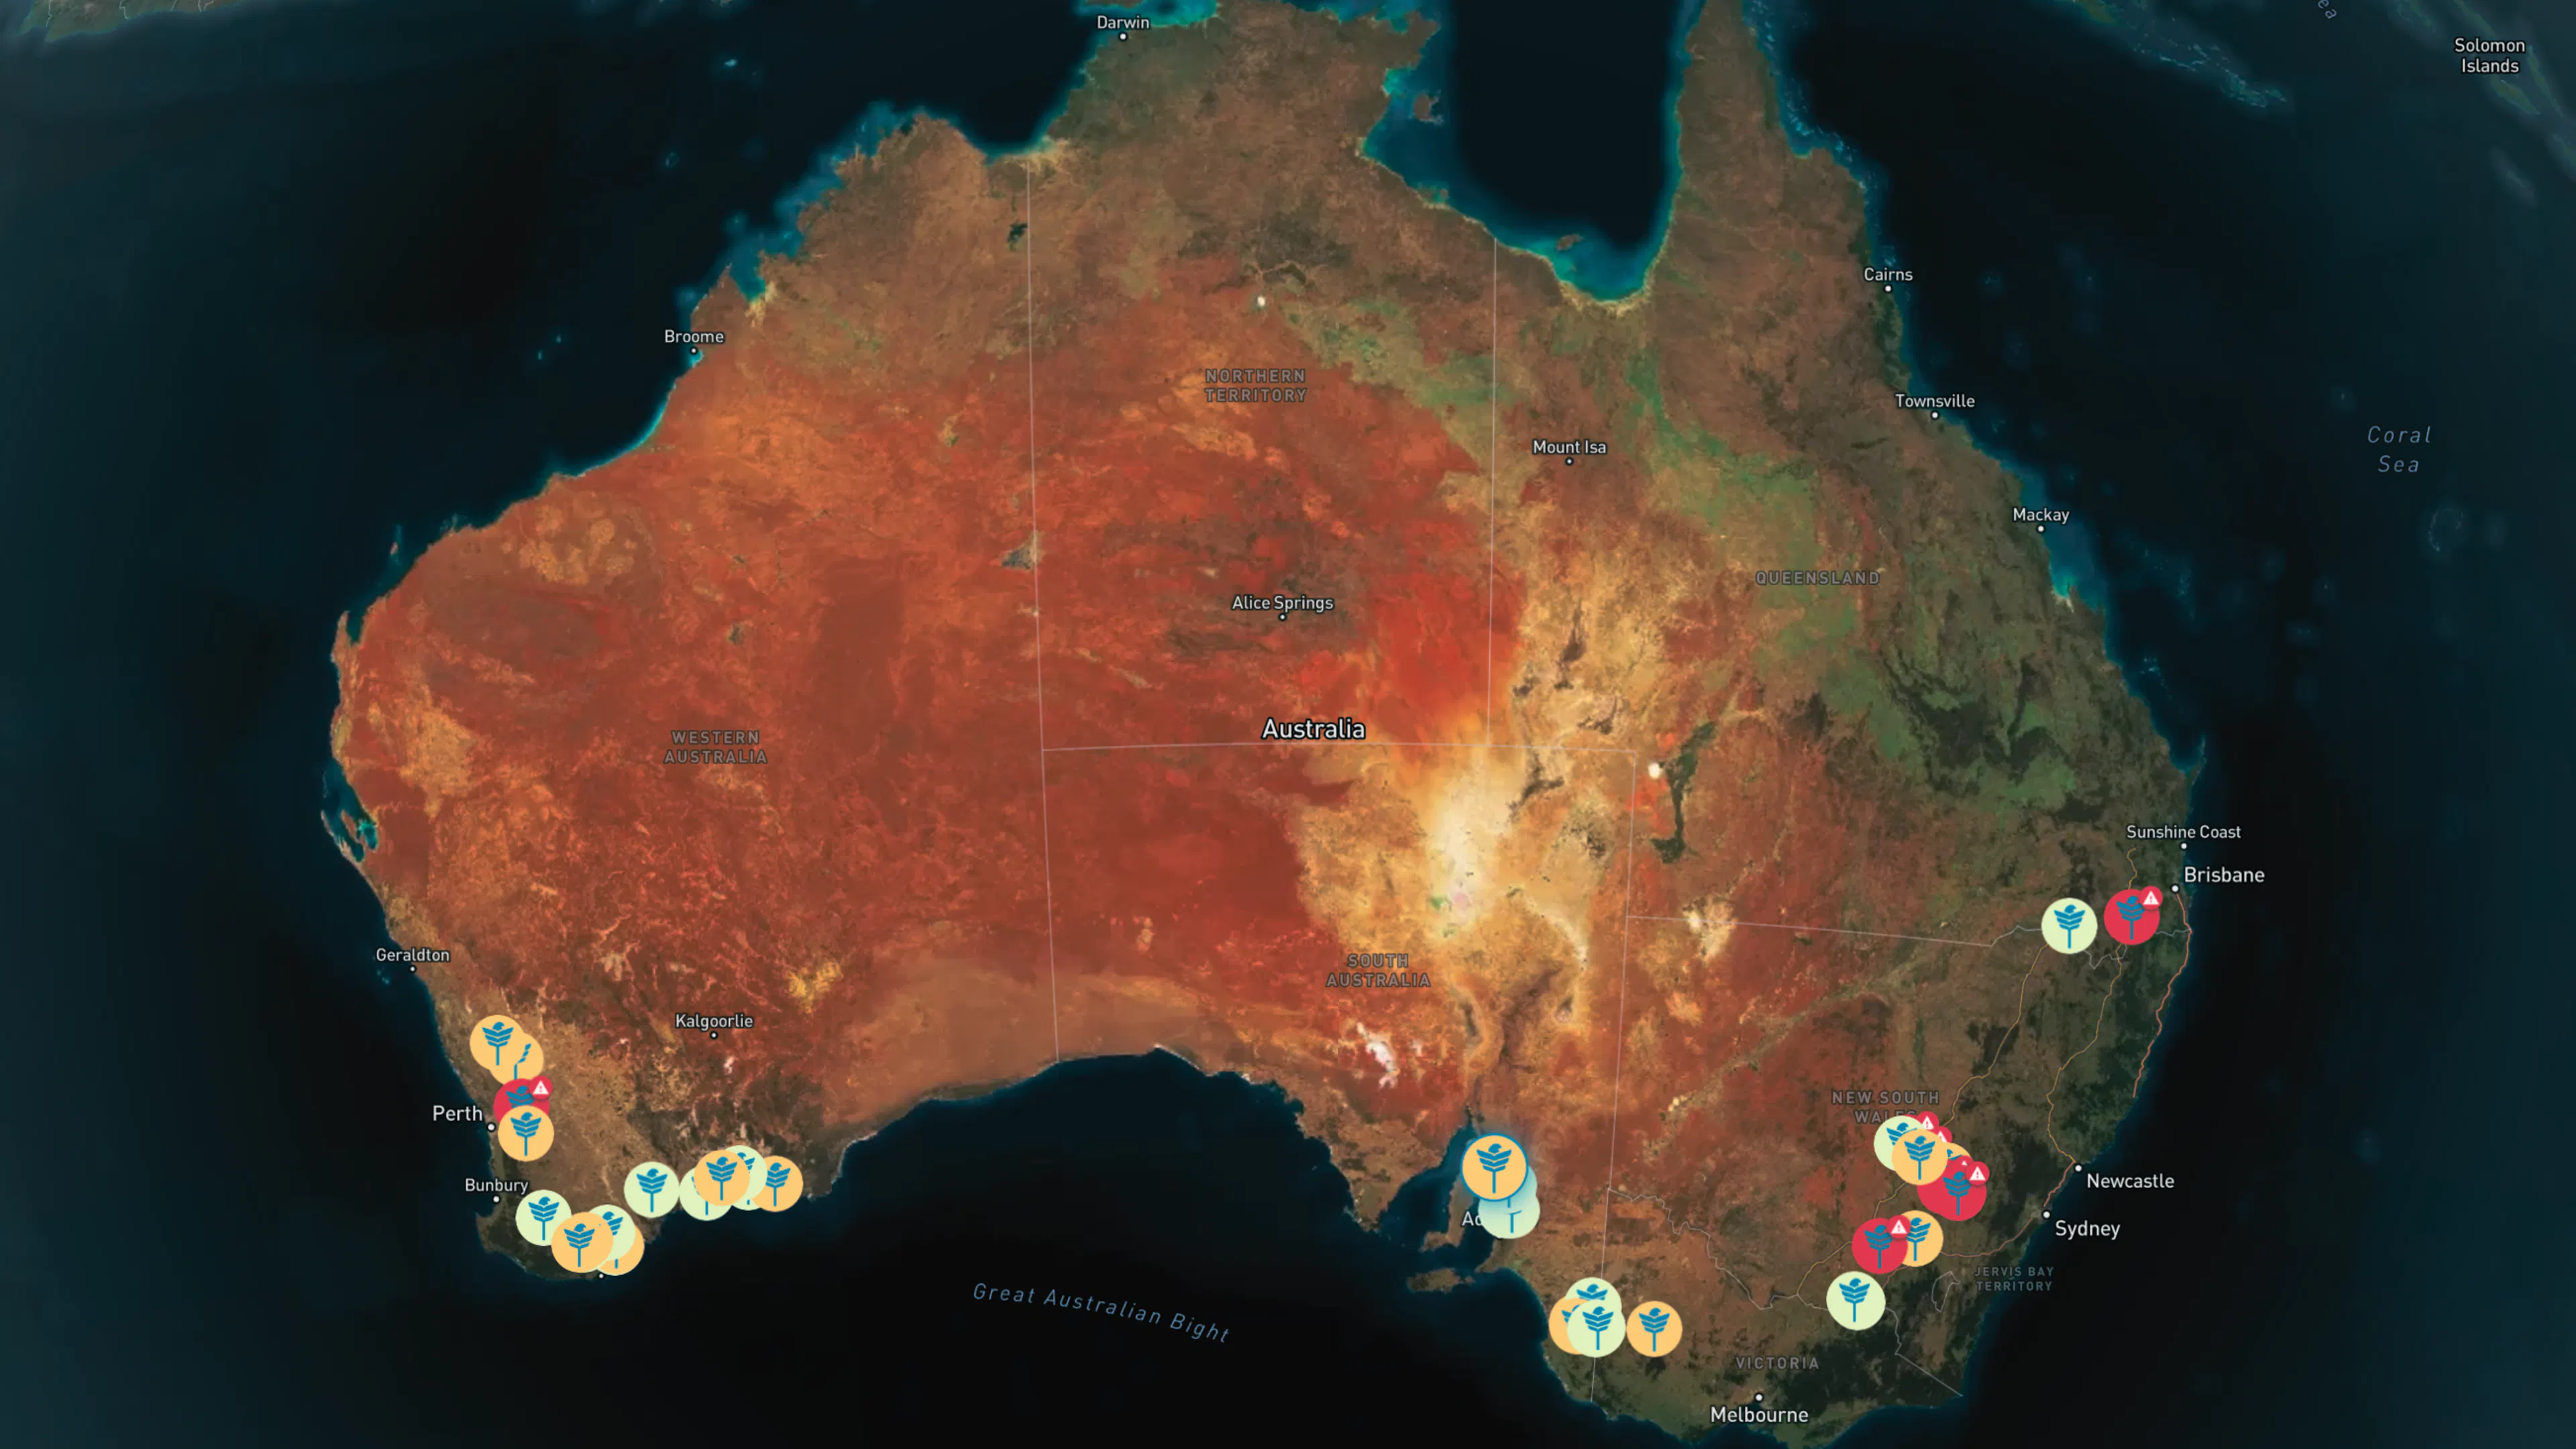
Today on the Network
Each map icon represents a sensor around Australia. Sign up for free to see several more features alongside the spore loads.

Context is Everything. Fungal pressure doesn't happen in a vacuum. The BioScout dashboard integrates local weather data so you can validate infection conditions instantly.
- Wind Speed & Direction: Understand where the spores are travelling.
- Temperature & Humidity: Confirm if conditions favour infection.
- Rain Events: Correlate moisture with spore release.
Track daily trends, not just alerts. Go beyond the risk rating. Access detailed daily graphs to see exactly which pathogens are spiking and which are absent in your district. Whether on mobile or web, you can track infection trends over time to distinguish between a minor blip and a sustained pressure event.

Filter the noise. Focus on your farm. With 60 units reporting across the country, you may want to focus on what is most important to you. Customise your dashboard by ‘favouriting’ the sensors closest to your boundary. This filters the map, ensuring that every time you log in, you see the specific local data that matters to your operation first.

Validated by Science
We don't guess. The network is grounded in rigorous science and research with our partners.

SARDI & DPIRD
We partner with leading research institutes to "ground truth" our data against traditional spore traps and DNA analysis.
FAR & BCG
Ongoing trials with FAR Australia and the Birchip Cropping Group (BCG) compare BioScout-led spray regimes against traditional calendar methods to prove efficacy.

End User
We leverage user feedback to improve our disease surveillance network, enhancing functionality and streamlining reporting for better response readiness.